Paper summary · Inverse Problems · 2022
Conductivity maps for 2D materials
Using measurements around the edge of a sample to estimate how conductivity varies inside it.
The question
Electrical impedance tomography uses boundary measurements to estimate the distribution of conductivity inside a sample. For thin materials such as graphene, which choices of electrodes produce useful measurements?
The approach
We used machine learning to select electrode configurations adaptively and studied ways to turn the resulting voltage measurements into conductivity maps.
What we found
We evaluated electrical impedance tomography on a graphene laminate film. The work shows how machine learning can help with two parts of the problem: collecting measurements and reconstructing the image.
Paper
Machine learning enhanced electrical impedance tomography for 2D materials
Adam Coxson and colleagues
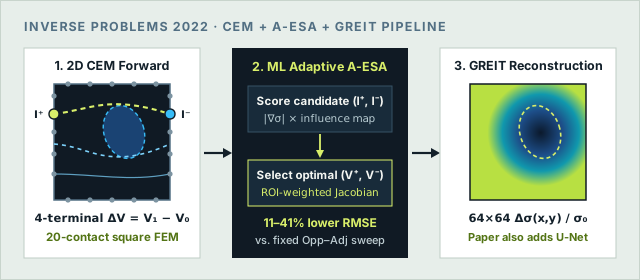
Watch a 2D conductivity map emerge measurement by measurement
Smooth cubic interpolation between sequential pyEIT + GREIT reconstructions lets you watch the conductivity map crystallize across 10 → 124 four-terminal measurements—comparing fixed opposite–adjacent scanning against ML Adaptive Electrode Selection (A-ESA) across three synthetic graphene phantoms.